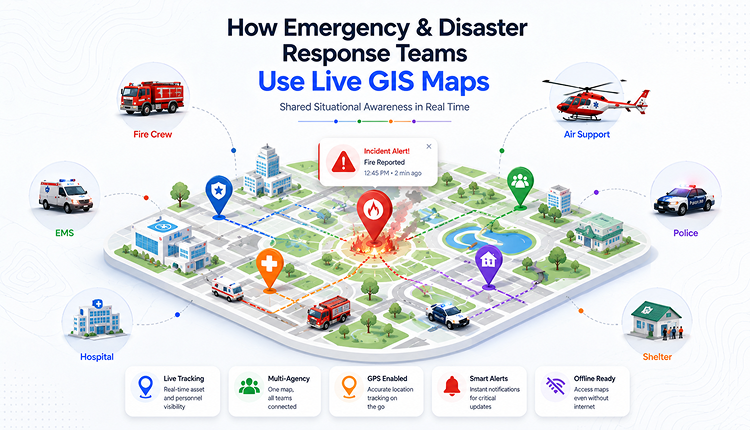
How Emergency & Disaster Response Teams Use Live GIS Maps
How a Single Shared Map Replaces Guesswork in the First Hour of a Crisis
During the first hour of a wildfire, a flood, or a building collapse, the biggest obstacle usually isn't a lack of people or equipment; it's a lack of shared, current information. A fire crew on the north perimeter often has no idea what the crew on the south side is seeing. A dispatcher fielding forty calls at once has no easy way to see which of those calls are describing the same event. Live GIS maps exist to close that gap, and over the past decade they've moved from a specialist GIS department tool to something incident commanders pull up on a laptop within minutes of a call coming in.
This isn't about pretty maps. It's about getting the right resource to the right location before conditions change again, which, in a disaster, they always do.
Live GIS maps are geographic information system maps that update in real time, showing the current location of incidents, personnel, hazards, and resources on a single shared view. Emergency and disaster response teams use them to coordinate multi-agency operations, track evolving threats such as fires and floods, and make faster, better-informed decisions during a crisis.
What a Live GIS Map Actually Is
A live GIS map layers real-time data, GPS positions of vehicles and personnel, incident reports, weather feeds, hazard zones, and road closures onto a base map that everyone involved in the response can see at the same time. Unlike a printed evacuation map or a static PDF, the data refreshes continuously, so what the incident commander sees at 2:14 p.m. reflects what's actually happening at 2:14 p.m., not what was true when the map was last updated.
The "GIS" part matters here too. Geographic Information Systems don't just plot points; they let responders layer multiple datasets: population density overlaid on a flood zone, hospital locations near a wildfire perimeter, or utility lines crossing a search-and-rescue grid. That layering is what turns a map into a decision-making tool rather than a picture.
Why Static Maps Fail During an Active Emergency
Printed maps and pre-loaded PDFs assume the situation stays still. Disasters don't cooperate. A fire's edge can move a quarter-mile in twenty minutes. A flood's extent depends on rainfall that's still falling. A search grid needs to update the moment a team clears an area, or two crews end up covering the same ground while another goes unchecked.
Static mapping also breaks down across agencies. Fire, police, EMS, and utility crews each tend to keep their own records, often in different formats, updated at different intervals. Without a shared live view, the "common operating picture" that emergency management doctrine talks about doesn't actually exist; it exists as four separate pictures that don't match.
How Response Teams Use Live GIS Maps (Step-by-Step)
- Establish the base layer. Load the affected area's map with existing infrastructure: roads, hospitals, shelters, utility lines, and evacuation routes.
- Connect live data feeds. GPS trackers on response vehicles, weather and hazard APIs, and incident report systems feed directly into the map.
- Assign zones and resources. Commanders mark search grids, evacuation zones, or fire perimeters directly on the shared map.
- Share access across agencies. Fire, police, EMS, and utility teams view the same live map from their own devices, in the field or at a command post.
- Update as conditions change. Crews mark areas as cleared, hazards as resolved, or routes as blocked, and the whole team sees it instantly.
- Log the incident for after-action review. Time-stamped map data becomes the record used to evaluate response time and coordination once the incident closes.
Key Features Emergency Agencies Rely On
- Real-time location tracking for vehicles, personnel, and mobile assets
- Multi-layer data : weather, hazard zones, infrastructure, population data viewable together or separately
- Multi-agency access so fire, police, EMS, and utilities work from one shared view
- Offline functionality for areas where cellular networks go down during a disaster
- Mobile compatibility so field teams aren't tied to a command-post terminal
- Historical logging for after-action reports and training
Benefits for Different Response Roles
For incident commanders: a single shared view instead of four separate radio reports, which speeds up resource allocation and reduces duplicated effort.
For field crews: visibility into what nearby teams are doing, which cuts down on both dangerous gaps in coverage and redundant coverage of the same area.
For dispatchers: the ability to see incoming reports plotted against active response zones, making it easier to spot when multiple calls describe the same event.
For public safety officials: better data for public communication evacuation zone boundaries and shelter locations that are accurate at the moment they're published, not from the last printed update.
Real-World Examples
During a fast-moving wildfire, a regional fire authority used a live GIS map to track the fire's perimeter alongside GPS positions of every engine crew. When the wind shifted the fire's direction faster than expected, commanders could see which crews were now closest to the new threat and redirect them without waiting for a full radio check-in round.
A coastal emergency management office facing seasonal flooding built a live map layering real-time river gauge data with road closure reports. Residents and response teams could see, at any moment, which routes were still passable — something a static evacuation map printed the week before couldn't have shown.
Live GIS Maps vs. Traditional Emergency Mapping
| Feature | Printed / Static Maps | Radio-Based Coordination | Live GIS Maps |
|---|---|---|---|
| Reflects current conditions | No | Partially | Yes |
| Shared across agencies | No | Limited | Yes |
| Tracks personnel and assets | No | No | Yes |
| Works offline in the field | Yes | Yes | It depends on the tool. |
| Supports after-action review | Limited | Limited | Yes |
| Scales to multi-agency response | No | Difficult | Yes |
Best Practices
- Set up live GIS mapping systems before an emergency hits; not during one. Response time matters most in the first hour
- Train every team that will use the map, not just the GIS specialists, since field crews are often the ones updating it in real time
- Build in offline or low-bandwidth fallback modes for areas where infrastructure may be damaged
- Standardise how zones and hazards get marked so multiple agencies read the map the same way
Common Mistakes to Avoid
- Relying on a single agency's data feed instead of integrating inputs from every team involved
- Skipping training, which leaves the map underused when it matters most
- Ignoring offline capability, which becomes critical the moment cell towers go down
- Treating the live map as a one-time setup instead of a system that needs regular data and maintenance checks between incidents
Expert Tips
The agencies that get the most value from live GIS mapping tend to run it during routine, non-emergency operations too — planned events, training exercises, even everyday dispatch — so that by the time a real disaster hits, the system and the team using it are already familiar with each other. Waiting until an emergency to learn the tool costs exactly the time the map was supposed to save.
Conclusion
Live GIS maps work because they replace guesswork with a shared, current picture of what's actually happening on the ground. For agencies coordinating a fast-moving wildfire, a flood, or a multi-agency search operation, that shared picture is often the single biggest factor in how fast and how safely a response comes together. The tools have moved well past the GIS department — they're now standard equipment for anyone making decisions in the first hour of a crisis.
FAQs
1. What is a live GIS map?
It's a geographic information system map that updates in real time, showing current incident locations, personnel positions, hazards, and resources on one shared view.
2. How is a live GIS map different from a regular map?
A regular map is a static snapshot. A live GIS map continuously updates as conditions change, and it can layer multiple real-time data sources — weather, traffic, personnel GPS — on top of a base map.
3. Which agencies typically use live GIS maps?
Fire and rescue departments, police, EMS providers, emergency management authorities, search-and-rescue teams, utility companies, and humanitarian organisations all use them during active incidents.
4. Do live GIS maps work without internet access?
Many modern platforms include offline or low-bandwidth modes specifically because disasters often damage the infrastructure that connectivity depends on.
5. Can multiple agencies view the same live GIS map at once?
Yes, shared, multi-agency access is one of the main reasons agencies adopt live GIS mapping, since it replaces separate agency-by-agency records with one common operating picture.
6. How do live GIS maps help with search and rescue operations?
They let teams mark search grids as cleared in real time, preventing duplicate coverage of the same area and highlighting zones that haven't been checked yet.
7. Are live GIS maps only useful during the emergency itself?
No time-stamped map data also supports after-action reviews, helping agencies evaluate response times and coordination once an incident closes.
8. What features should an agency look for in GIS mapping software?
Real-time location tracking, multi-layer data support, multi-agency access, offline functionality, mobile compatibility, and historical logging for after-action review.
9. How quickly can a live GIS map be set up during an active emergency?
Systems set up and tested before an emergency can be operational within minutes of an incident starting; building one from scratch during an active crisis is far slower and riskier.
